Tableau is a very popular BI tool and is widely used by major companies. In Tableau, we can connect multiple data sources and tables and create visualizations. Always, we get a question on how to create charts using multiple type of data sources on a single sheet in Tableau. Tableau graphics on a single sheet. Tableau has done a fantastic job at solving this issue. Multiple data sources can be used together in Tableau using data blending.
What is data blending?
A technique for merging or combining data from several data sources is called data blending. Using data blending, data from the primary data source is directly displayed in the view along with extra information from a secondary data source. Data blending is highly useful when we need to link fields from multiple data sources and use them to create a chart in a Tableau sheet.
Data blending doesn’t combine or join the data like join or relationships in Tableau. Data blending is performed sheet-by-sheet basis and is created when a field from a second data source is used in the sheet along the primary data source. Data blending involves querying every data source separately, aggregating the results to the proper degree, and then visually presenting the combined findings in the sheet. Blends cannot be published as a “blended data source” since they do not produce a new blended data source. To perform data blending, you must need at least 2 data sources.
The world is changing with the evolution of AI, and focus has shifted towards AI and data science. So with the sudden boom in data science and AI, learning and manipulating data has become a critical part.
How to create charts using multiple type of data sources on a single sheet in Tableau?
Follow the below steps to create the chart using multiple data sources on a same sheet.
Step 1 – Connect to the primary data source. Primary data sources can be added in multiple ways. Go to the data source tab and drag the table or sheet you want as the primary data source.
Step 2 – Create a new sheet and create the visual using the primary data source.

Step 3 – Add the secondary data source. Go to Date -> New Data Source, and then add the new data source you want to add. Secondary data sources can be any data source, like SQL, Hadoop, Teradata, etc.
Important condition to note - Both the data source should have a column column which should be use to link or blend the data.
Step 4 – Add a linking field: Once you add the secondary data source, you can see a linking field by default. Click on that to make the link active (if not active by default).

Step 5 – If no linking field was shown by default, then go to data → Edit blend relationships → Crete the blend relationship. Add the required columns to the blended relationship.


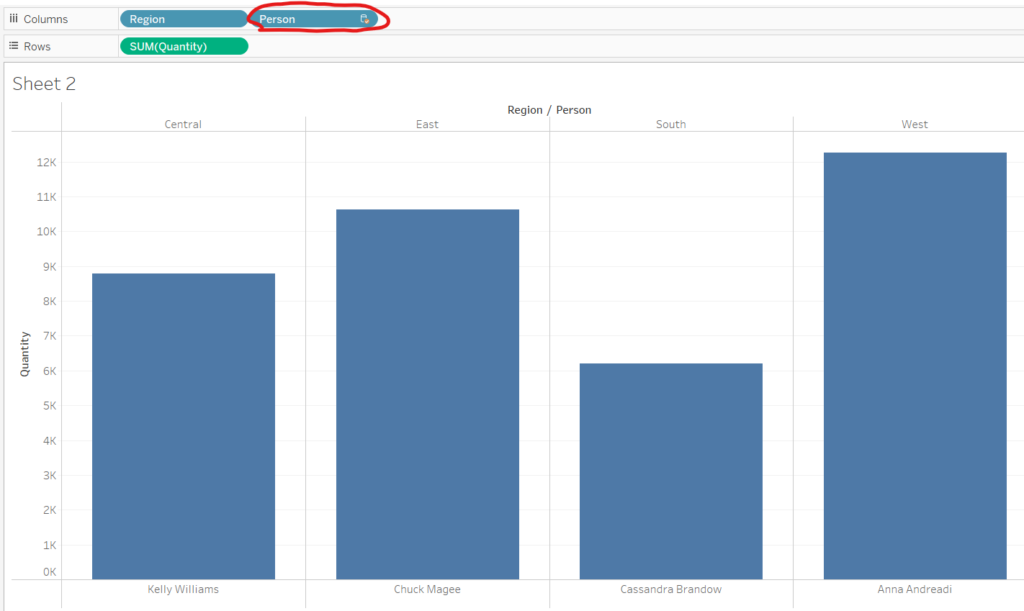
Once the data blend is completed, you can add the column from the secondary data source to the chart on the same sheet. In the example below, the column ‘person’ used in the column shelf is from a secondary data source, and the data blending is indicated by an orange check mark on the database icon.

Conclusion – In this post we have explained how to create charts using multiple type of data sources on a single sheet in Tableau and what is data blending. In Tableau you can use data blending to create chart from multiple type of data sources.
- Generative AI vs Agentic AI: What’s the Future?
- AutoML – The Future of Machine Learning? AutoML using Python
- How To Calculate P-Value in Excel? – Statistical significance in Excel
- Tableau 2024.2 new features – Einstein Copilot in Tableau
- Top 25 Python Interview Questions for Data Scientist and Analyst