P-value or probability value is a fundamental concept in hypothesis testing and it is an essential concept that helps to determine the significance of the results obtained from regression, A/B testing or correlation analysis. In this blog we will explain you the step by step guide to calculate p-value in excel and obtain the statistical significance in excel.
What is P-Value?
When conducting hypothesis testing, researchers can use the P-value, a statistical indicator, to assess the importance of their findings. You may determine whether the outcomes of your hypothesis test are significant by looking at the p-value. To ascertain whether there is sufficient evidence to reject the null hypothesis and embrace the alternative, it is frequently employed in hypothesis testing.

The P-value denotes the likelihood of receiving test results that are at least as extreme as the observed results, assuming the validity of the null hypothesis (H0). A lower P value suggests that the you can reject the null hypothesis (H0). f the p-value is low (typically less than 0.05), you reject the null hypothesis, indicating that your results are statistically significant.
How to Calculate P-Value in Excel? Step by Step Guide
There are multiple methods to calculate p-value in excel. P-value can be calculated using multiple scientific methods like T-test, Z-test etc. Here we are discussing the most used and easy methods to calculate the p-value in excel –
- Excel functions related to p-value
- Using the t-test tool from the “Analysis Tool pack”
Calculate P-Value in Excel Using Excel Function
To determine the statistical significance of the trial or A/B test you performed, you must check the p-value. The most common way to calculate the p-value is by performing a t-test, which compares the means of two groups (the trial and control group or the A group and B group). Excel has a built-in function to perform T-test also has a function to perform Z-test. Below is the function to calculate the P-value in Excel:
#Excel function to calculate p-value using T-test

T.TEST(array 1, array 2, tails, type)- T.TEST = Name of the function to perform T test
- Array 1 = cell range of the first data set
- Array 2 = cell range of the second data set
- Tails = Number of distribution tails. Use 1 for a one-tailed test or 2 for a two-tailed test
- Type = The test that you intend to perform, Use
1for a paired t-test,2for a two-sample equal variance t-test, or3for a two-sample unequal variance t-test.
For example here we are using two-tailed T-test and it is two-sampled equal variance to get the p-value. In the below example the cells B2:B21 is the array 1 and C2:C21 is the array 2. Followed by ‘2’ representing the two-tailed test and the next ‘2’ representing two-sample equal variance t-test
=T.TEST($B$2:$B$21,$C$2:$C$21,2,2)
How to select Type in the T-test?
- Paired T-test- Used when we are comparing two related groups, it is used when measuring the same group before and after. For example measuring the employees performance before after the training program.
- Two-sample equal variance t-test – Used to compare two independent groups, and you assume that both groups have the same variance. For example comparing two different set of employees who attended same training under same condition.
- Two-sample unequal variance t-test – Used to compare two independent groups, but you do not assume that the variances of the two groups are equal. For example comparing two different set of employees where the variability in scores between the groups might differ.
Will AI Take Away Jobs in Future? 85 million jobs would be lost to AI worldwide by 2025
Calculate T-test using the t-test tool from the “Analysis ToolPak”
The Data Analysis Toolpak is a more extensive statistical analysis tool that Excel also provides. One of Excel’s tools for determining p-value is the Analysis ToolPak t-test. This section will demonstrate how to compute the P-value in Excel using the Analysis Toolpak.
Enable Analysis ToolPak in Excel –
- Click on File –> Click on Options
- Click on the ‘Add-ins‘ option in the sidebar
- Select Analysis ToolPak –> Click Manage –> Click Go
- Select Analysis ToolPak add-in

Perform T-Test in Excel using Analysis ToolPak
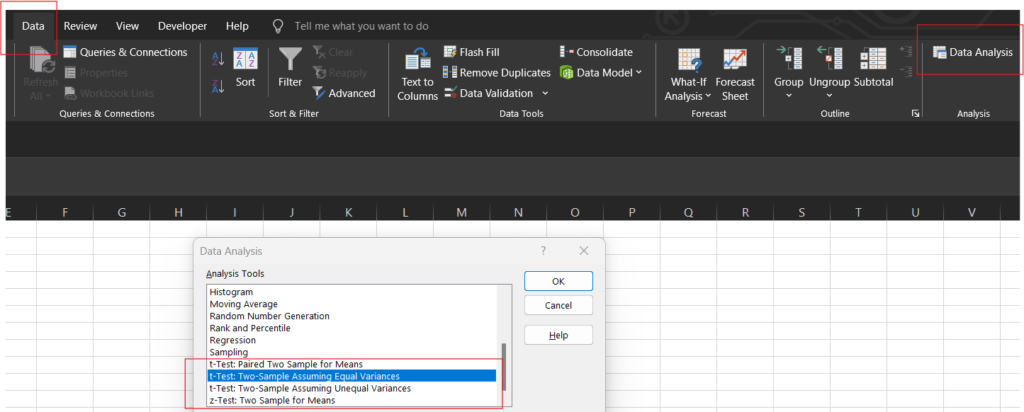
- Select Data tab from menu –> Click Data Analysis
- Select the type of t-Test for example select Two-Sample Assuming Equal Variances

3. Select the variable 1 range and variable 2 range.
4. Add Hypothesis Mean Difference or keep it empty
5. Type your alpha value into the box
6. Click OK and you p-value is ready.
Conclusion
P-value is an essential statistical tool that aids in hypothesis testing and significance analysis of findings. You may easily ascertain the statistical significance of your findings by using Excel’s p-value calculation function. Excel has tools for conducting hypothesis tests that are easily accessible, whether you use the Data Analysis Toolpak or the T.TEST function.


